|
The objective of a historical statistical volume is to provide a convenient reference source which has two functions, collecting and referring. The collecting function consists of assembling, selecting, and arranging data from thousands of sources and making them available within a single source. The referring function consists of text annotations to the data which act as a guide to sources of greater detail.
Statistics are a valuable adjunct to historical analysis. They often clarify and enrich qualitative history and on occasion become important parts of a historical record on their own.
Titles include:
Statistical Abstract of the United States 1878 to 2012
Historical Statistics of the United States, Colonial Times to 1970
Historical Statistics of the United States, 1789 - 1945
The discs contain:
Historical Statistics of the United States, Colonial Times to 1970
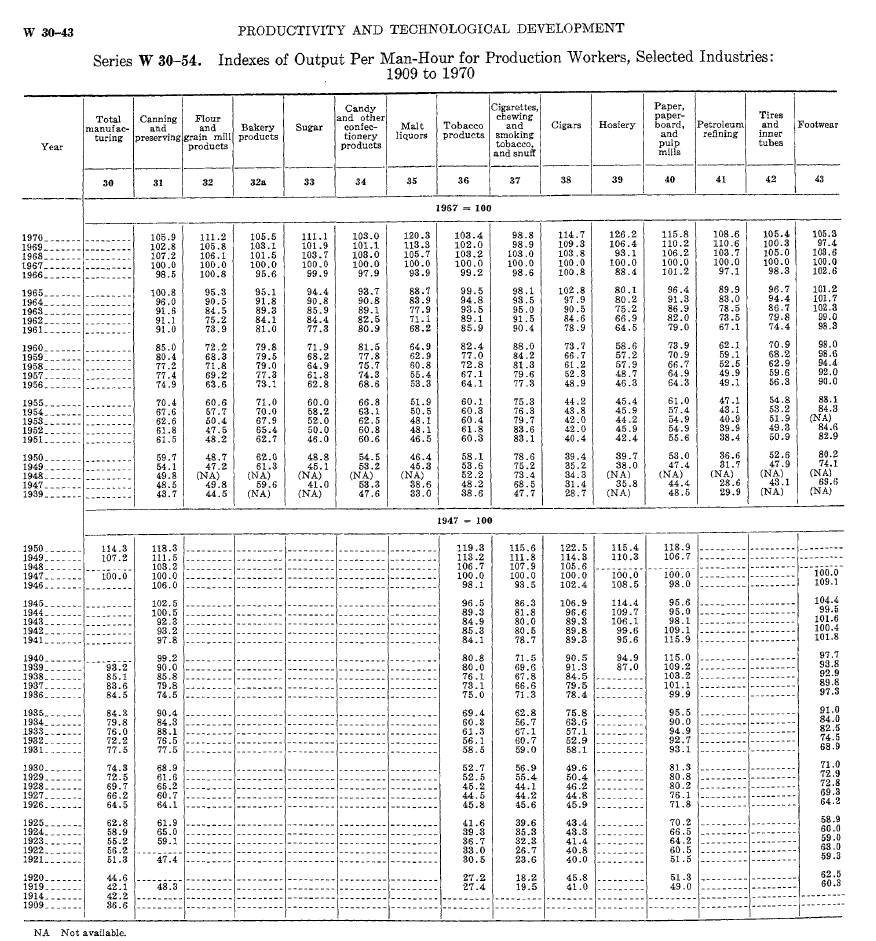
A two volume, 1,298 page, Bicentennial Edition published by the Bureau of the Census in 1975. It contains 12,500 time series covering Population, Vital Statistics and Health and Medical Care, Migration, Labor, Prices and Price Indexes, National Income and Wealth, Consumer Income and Expenditures, Social Statistics, Land, Water, and Climate, Agriculture, Forestry and Fisheries, Mineral, Construction and Housing, Manufactures, Transportation, Communications, Energy, Distribution and Services, International Transactions and Foreign Commerce, Business Enterprise, Productivity and Technological Development, Financial Markets and Institutions, Government and Colonial and Pre-Federal Statistics.
Historical Statistics of the United States, 1789 � 1945
Published in 1949, this 372 page reference contains approximately 3,000 statistical time series which cover various periods from 1789 to 1945. In a very few instances, figures are shown for the colonial period and the years under the Continental Congress. These statistics reflect economic, social, and political aspects of the development of the Nation since the Federal Government was formally established.
Statistical Abstract of the United States 1878 to 2012 - 126 Volumes
126 volumes, 106,069 pages, of the Statistical Abstract of the United States, 1878-1883, 1885, 1887-1889, 1891-1922, 1924-1926, 1928-1931, 1933-1942, 1944-1974, and 1976-2012.
The Statistical Abstract of the United States, also known as the National Data Book, was a publication of the United States Census Bureau, an agency of the United States Department of Commerce. It was filled with data that gives us an indication of who and what we are as a nation and a people. Family debt, manufacturing, national security, international statistics � there doesn't seem to be anything that the Statistical Abstract didn't cover.
You can use the Abstract as a convenient volume for statistical reference, and a guide to sources of more information both in print and on the Web. Its sources of data include the Census Bureau, Bureau of Labor Statistics, Bureau of Economic Analysis, and many other Federal agencies and private organizations.
Published since 1878, the statistics describe social and economic conditions in the United States. It is the standard summary of statistics on the social, political, and economic organization of the United States. It was designed to serve as a convenient volume for statistical reference and as a guide to other statistical publications and sources.
The latter function is served by the introductory text to each section, the source note appearing below each table, and Appendix, which comprises the Guide to Sources of Statistics, the Guide to State Statistical Abstracts, and the Guide to Foreign Statistical Abstracts.
Revisions were made each year to adapt it to meet current needs and uses, and to bring the various statistical series up to date.
Highlights from the Statistical Abstract of the United States: 2012 (131st Edition) include 53 new tables containing:
Parent participation in school-related activities, Federal aid to state and local governments, Type of work flexibility provided to employees, Residential energy consumption, Stalking and Harassment Victimization, Federal Research and Development by Federal Agency, and Number of Public Library Service Outlets.
Data highlights for the 2012 edition include:
Between April 1, 2000 and April 1, 2010 there was a 9.7 percent increase in the resident population of the United States. The state with the highest percentage increase in resident population during the same time period was Nevada (35.1), while the only state that experienced a decrease was Michigan (-0.6).
In 2009, 16.7 percent of people in the United States were not covered by health insurance.
In the November election of 2010, 65.1 percent of U.S. citizens reported being registered to vote. 45.5 percent reported actually voting in the election.
The federal budget debt increased from $13.5 trillion in fiscal year 2010 to an estimated $15.5 trillion for Fiscal Year 2011.
In 2009, there were roughly 388,000 business startups (businesses less than 1 year old), which created 2.2 million jobs. While service industry firms aged 1-10 years experienced the largest number of firm deaths (212,000), the manufacturing industry experienced the greatest amount of job loss due to firm deaths and contractions, losing almost 1.3 million jobs. All industries together suffered a net job loss of 4.8 million in 2009.
Number of crude oil producing wells as of December 31, 2009 remained the same at 526,000. The daily output increased from 9.4 thousand barrels in 2008 to 10.1 thousand barrels in 2009.
In 2008, 40.6% of all live births in the United States were to unmarried women. In comparison, the same number was 52.6% in France and 32.1% in Germany.
In 2009, the U.S. gave over $28.8 billion in Official Development Aid to foreign nations, more than any other country. However the U.S. did not give as much as some other countries as a percentage of its income, donating only 0.21% of its Gross National Income (GNI). Sweden was at the top of that list, giving 1.12% of its GNI, followed by Norway (1.06%), and Luxembourg (1.04%).
Highlights from the Statistical Abstract of the United States 130th Edition (2011), include the new tables:
Insufficient Rest or Sleep by Number of Days and Selected Characteristics: 2008
Students Who Reported Being Bullied at School or Cyber-Bullied by Selected Student Characteristics: 2007
Financial Crimes: 2003 to 2009
Carbon Dioxide Emissions by Sector and Source: 1990 to 2008
Private Sector Gross Job Gains and Job Losses: 2000 to 2009
Certified Organic Farmland, Crops, and Livestock: 2000 to 2008
There's some upbeat information in the 130th edition. Table 295 tells us that more and more Americans are receiving degrees every year, while Table 1237 indicates how many of us are turning out for the arts; 7.8 million people went to a jazz concert in 2008.
Over the years the scope of coverage increased. Sections found in later editions of the Statistical Abstract of the United States include:
Agriculture:
Agricultural Exports and Imports
Crops
Farm Income and Balance Sheet
Farms and Farmland
Meat and Livestock
Arts, Recreation, & Travel:
Arts Activities
Consumer Expenditures
Establishments, Revenue, Employees, and Payroll
Recreation and Leisure Activities
Travel and Tourism
Banking, Finance, & Insurance:
Banks, Savings Institutions, Credit Unions
Finance and Insurance Industries
Financial Assets and Liabilities
Household Financial Assets and Liabilities
Insurance
Money Stock, Interest Rates, Bond Yields
Mutual Funds, Securities Industry
Payment Systems, Consumer Credit, Mortgage Debt
Real Estate, Rental, and Leasing
Stocks and Bonds, Equity Ownership
Births, Deaths, Marriages, & Divorces:
Births
Deaths
Family Planning, Abortions
Life Expectancy
Marriages and Divorces
Business Enterprise:
Economic Indicators
Establishments, Employees, Payroll
Investment, Capital Expenditures
Multinational Companies
Patents, Trademarks, Copyrights
Profits
Sole Proprietorships, Partnerships, Corporations
Women and Minority-Owned Businesses
Construction & Housing:
Authorizations, Starts and Completions
Commercial Offices
Construction Indices and Value
Construction Industry
Homeownership and Housing Costs
Housing Sales
Housing Units and Characteristics
Housing and Neighborhood Quality
Education:
All Levels of Education
Educational Attainment
Elementary and Secondary Education: Completions and Dropouts
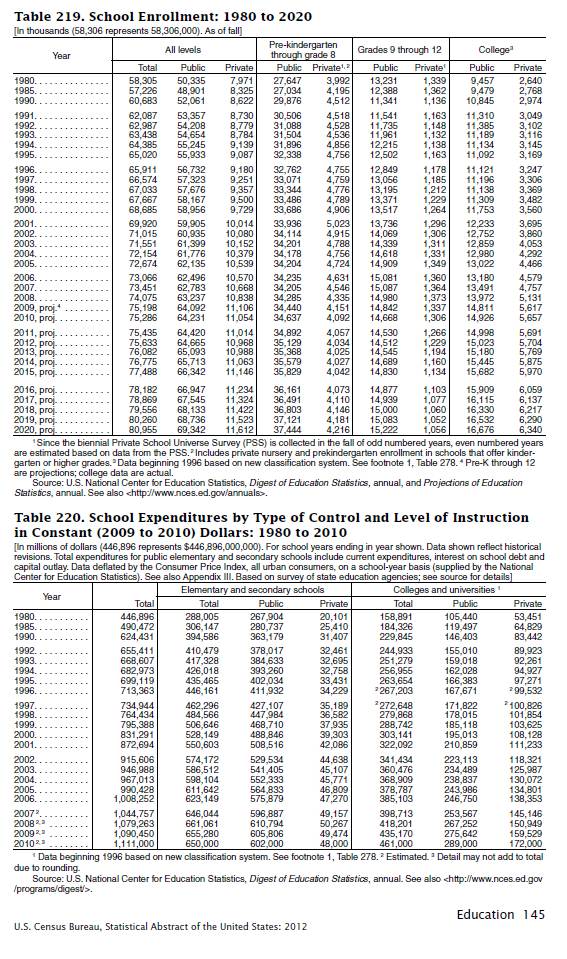
Elementary and Secondary Education: Schools and Enrollment
Elementary and Secondary Education: Special Topics
Elementary and Secondary Education: Staff and Finances
Elementary and Secondary Education: Summary
Elementary and Secondary Education: Technology, Courses, and Test Scores
Higher Education: Degrees
Higher Education: Finances, Fees and Staff
Higher Education: Institutions and Enrollment
School Choice
School Crime and Safety
Elections:
Campaign Finance
Congressional
Elected Public Officials-Characteristics
Gubernatorial and State Legislatures
Presidential
Voting-Age Population and Voter Participation
Energy & Utilities:
Crude Oil, Petroleum
Electricity
Gas Utility
Nuclear
Prices, Expenditures, Sales
Production, Consumption, Trade
Solar and Renewable Energy, Emissions
Utilities
Water and Sewage Systems
Federal Government Finances & Employment:
Federal Budget--Receipts, Outlays, and Debt
Federal Civilian Employment
Federal Individual Income Tax Returns
Federal Land
Foreign Commerce & Aid:
Exports and Imports
Foreign Aid
Foreign Investment
International Transactions
Forestry, Fishing, and Mining:
Coal
Fisheries, Aquaculture
Forest Land and Timber-Based Manufacturing
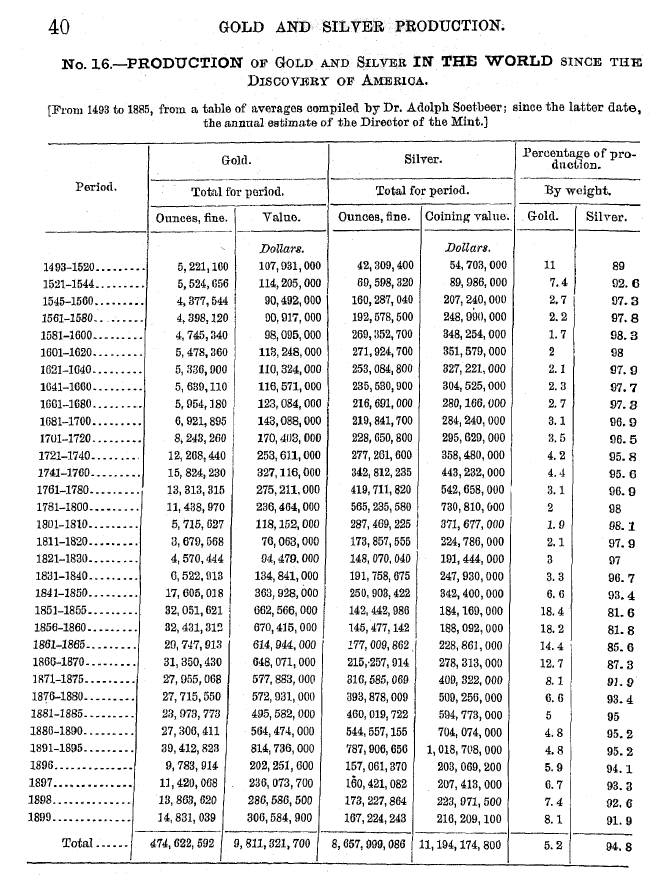
Mining, Mineral Industries
Natural Resource-Related Industries
Petroleum Industry, Natural Gas
Geography & Environment:
Air Quality
Environmental Industry; Threatened and Endangered Species
Land, Land Use, and Earthquakes
Solid Waste, Hazardous Waste, and Superfund
Water, Water Use and Quality
Weather Events and Climate
Health & Nutrition:
Food Consumption and Nutrition
Health Care Resources
Health Care Utilization
Health Conditions, Diseases
Health Expenditures
Health Insurance
Health Risk Factors
Medicare, Medicaid
Income, Expenditures, Poverty, & Wealth:
Consumer Expenditures
Family Income
Gross Domestic Product (GDP)
Household Income
Income and Poverty--State and Local Data
Income for Persons
Personal Income
Poverty
Wealth
Information & Communications:
Information Sector Services & Media Usage
Internet Publishing and Broadcasting and Internet Usage
Internet Service Providers, Data Processing, & Libraries
Motion Picture and Sound Recording Industries
Publishing Industries
Radio and TV Broadcasting and Cable TV
Telecommunications
International Statistics:
Agricultural Production and Trade
Climate, Environment
Economy
Finance and Expenditures
Foreign Commerce and Aid and Military
Government Receipts, Expenditures, Debt
Labor Force
Natural Resources and Energy
Population, Households
Prices
Telecommunications, Computers
Vital Statistics, Health, Education
Labor Force, Employment, & Earnings:
Compensation, Wages and Earnings
Employed Persons
Employment Benefits
Employment Projections
Employment and Earnings--Establishment Basis
Injuries and Fatalities
Job Gains and Losses
Labor Force Status
Productivity
Unemployed Persons
Work Stoppages and Unions
Law Enforcement, Courts, & Prisons:
Arrests
Correctional Facilities, Prisoners
Courts
Crimes and Crime Rates
Criminal Justice Expenditures
Criminal Victimizations
Fire Losses
Juvenile Delinquency, Child Abuse
Manufactures:
Finances
Manufactures--Establishments, Shipments, Employees, Payroll
Nondurable Goods Industries
Semiconductors, Computers, Telecommunications Equipment
Shipments, Orders, Inventories
Steel and Machine Tools
Transportation Equipment, Appliances
National Security & Veterans Affairs:
Defense Outlays
Homeland Security
Military Personnel and Expenditures
Veterans
Population:
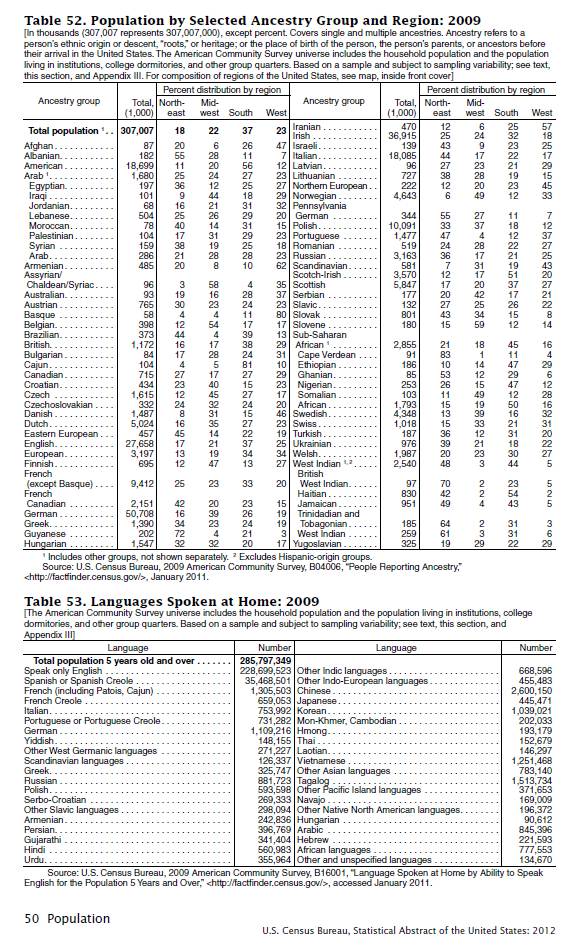
Ancestry, Language Spoken At Home
Elderly, Racial and Hispanic Origin Population Profiles
Estimates and Projections by Age, Sex, Race/Ethnicity
Estimates and Projections--States, Metropolitan Areas, Cities
Households, Families, Group Quarters
Marital Status and Living Arrangements
Migration
National Estimates and Projections
Native and Foreign-born Populations
Religion
Prices:
Consumer Price Indexes, Cost of Living Index
Food Cost and Prices
Fuel Prices
Price Indexes
Producer Price Indexes
Puerto Rico & the Island Areas
Science & Technology:
Employment
Expenditures, Research Development
Space
Students and Degrees Conferred
Social Insurance & Human Services:
Child Support, Head Start, Child Care
Employee Benefits, Government Transfer Payments, Social Assistance
Food Programs
Philanthropy, Nonprofit Organizations, Volunteering
Social Security, Retirement Plans
Supplemental Security Income, Temporary Assistance to Needy Families
Unemployment, Disability, Workers' Compensation
State & Local Government Finances & Employment:
Employment and Payroll
Federal Aid to State and Local Governments
Governmental Units
Local Government Finances
Receipts, Expenditures, Investment
State Government Finances
State and Local Government Finances
Transportation:
Air Transportation Fatalities and Complaints
Airline Operations and Traffic
All Modes of Transportation
Highway Financing
Highway Infrastructure and Use
Motor Vehicle Accidents and Fatalities
Motor Vehicle Registrations, Alternative Fueled Vehicles
Trucks, Railroads, Pipelines
U.S. Postal Service
Urban Transit
Water Transportation
Wholesale & Retail Trade:
Establishments, Sales, Payroll and Employees
Motor Vehicle Sales
Online Retail Sales
Retail Trade Sales
Wholesale Trade Sales |